
How to Measure the True Success of an Exhibition Booth
From Design to Sales: How to Measure the True Success of an Exhibition Booth
Participating in trade shows and conferences is one of the most significant annual marketing investments a company can make. Between the costs of booking space, preparing the team, and designing and constructing an exhibition booth, companies spend substantial sums with the goal of making a strong impression and attracting new clients. Yet, once the exhibition curtains close and the event concludes, the most critical question arises for senior management: “Was this design worth the cost? And how do we know if the booth actually achieved its objectives?”
In the past, evaluating the success of a booth design relied heavily on subjective impressions—such as the aesthetic appeal of the lighting, positive feedback from visitors, or the team’s own sense of satisfaction. However, in today’s era of data-driven digital marketing, relying on anecdotal impressions is no longer sufficient. The real challenge now lies in linking the design’s structural and aesthetic elements to concrete metrics, sales volume, and the number of successful engagements that took place within the booth.
In this article, we will delve into the process of measuring the Return on Investment (ROI) for booth design, exploring how you can translate every curve, display screen, and reception area into tangible figures and results that demonstrate the effectiveness of your investment.
Read also: Steps for Designing and Executing Exhibition Booths
First: The basic formula for measuring Return on Investment (ROI) for exhibitions
Before linking design to figures, it is necessary to define the concept of return on investment (ROI) in the context of exhibitions. In its most direct form, financial ROI is calculated using the following equation:
ROI (%) = [(Total revenue generated from the exhibition – Total participation costs) ÷ Total participation costs] × 100
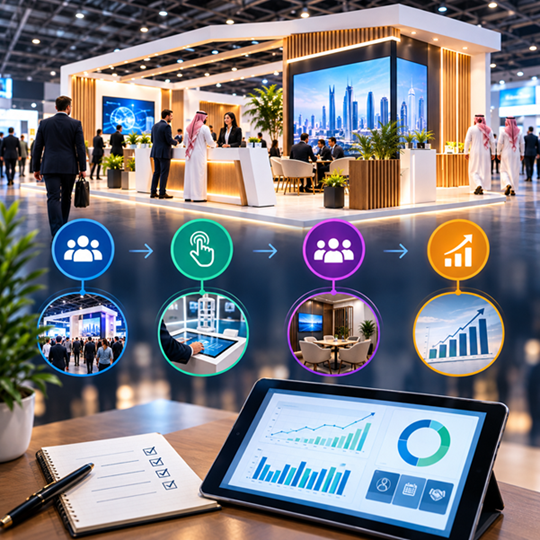
However, when specifically discussing “booth design,” the equation becomes more complex. Design does not generate direct sales on its own; rather, it serves as the primary driver that enables the sales and marketing team to achieve those sales. The design acts as a “physical funnel”—attracting visitors from the aisle, guiding them toward the interaction zone, and providing the ideal environment to close a deal or capture visitor data.
Second: Linking Design Elements to Key Performance Indicators (KPIs)
To measure the efficiency of a design in quantitative terms, you must break the booth down into functional zones and link each zone to a specific KPI:
External Attraction Elements and Visitor Traffic Flow
These elements include the height of the facade, external interactive screens, directional lighting, and illuminated logos.
Associated Metrics: The number of visitors who stopped in front of the booth, and the number who actually entered the interior space.
How does design influence this? An open-plan facade with accessible entry points reduces the “psychological barrier to entry” for visitors. The efficiency of this element can be measured using heatmaps or visitor-counting cameras to determine the proportion of visitors drawn to the booth relative to the total number of people passing through the aisle.
Product Experience Zone
This zone includes interactive platforms, touchscreens, and live product demonstrations.
Key metrics: Average visitor dwell time within the booth and the number of interactions with devices or products.
How does design measure this? A successful design arranges products in a way that prevents crowding and congestion, providing visitors with a comfortable space to explore. An increase in “dwell time”—without the booth becoming overcrowded—indicates that the spatial layout was effective in keeping visitors engaged and enjoying the experience.
Meeting & Networking Zones
This zone includes high-top tables or private rooms equipped for hospitality and serious business discussions.
Key metrics: Number of qualified meetings and the number of preliminary contracts or partnership agreements signed during the exhibition.
How does design measure this? Soundproofing, comfortable seating, access to charging ports, and visual privacy are all design factors that directly influence the quality of a meeting. If a meeting area is noisy or uncomfortable, the meeting will likely end prematurely without achieving any results. Conversely, a smart design creates an environment that encourages prospective clients to stay longer and discuss the details of contracts or sales in complete comfort.
Third: Practical Steps for Measuring the Impact of Design on Sales and Meetings
To ensure you can accurately track metrics, the measurement process should follow three key stages:
Pre-Exhibition Phase: Setting Objectives and Space Planning
Determining the Target Cost Per Lead (CPL): Calculate the total cost of building and designing the booth, then establish a target number of leads to assess whether the design will achieve your desired cost-per-lead goal.
Integrating Technology into the Design: During the booth’s architectural planning phase, incorporate designated spaces for lead scanners or strategically placed QR codes throughout the stand.
During the Exhibition: Tracking On-Site Behavior
Monitoring Traffic Flow: Observe how visitors move within the booth. Are there “dead zones” that go unvisited due to poor layout? Does the reception area create a bottleneck that hinders others from entering?
Recording Meeting Quality: Categorize interactions within meeting areas (e.g., introductory meeting, qualified lead, or preliminary agreement). Linking this data to the usage of different areas within the booth will reveal which spaces are the most productive.
Post-Exhibition Phase: Digital and Financial Analysis
Calculate the conversion rate: Determine the ratio of the number of people who entered the booth to those who became “Sales Qualified Leads” (SQLs).
Track the extended sales cycle: Some trade shows do not generate immediate sales; instead, the sales cycle may span several months. Use a Customer Relationship Management (CRM) system to tag leads acquired at the trade show, and analyze how many actual sales—occurring over a period of 3 to 6 months—resulted from meetings held in the booth’s designated meeting area.
Fourth: Design Pitfalls to Avoid to Protect Your Return on Investment (ROI)
Often, poor design leads to wasted budgets and a diminished ROI—frequently without the company even realizing it. Key design errors include:
- Overloading with Visual Messages: Crowding booth walls with excessive text and logos overwhelms visitors, causing them to overlook the stand entirely. An effective design focuses on a single, clear message that remains legible from a distance of 5 meters.
- Neglecting Privacy for Conversations: Designing a completely open meeting area amidst the surrounding noise makes key clients uncomfortable when discussing sensitive financial or technical details, often prompting them to leave prematurely.
- Poor Lighting: Dim lighting can make a booth appear abandoned or unwelcoming, while overly bright or poorly directed lighting—shining directly into visitors’ eyes—creates visual discomfort that encourages them to depart quickly.
- Lack of Smooth Traffic Flow: Placing obstacles or large reception desks at the entrance acts as a barrier that repels visitors, rather than serving as a point of attraction and engagement.
The previous article outlined various errors in the design and execution of exhibition stands.
In conclusion: Design is not merely decoration—it is a strategic sales tool
Ultimately, the quality of an exhibition stand’s design should not be measured by aesthetic awards or the designer’s personal preference; rather, it should be judged by its actual ability to convert casual visitors into potential leads, and subsequently into concrete deals and sales.
When you begin planning for your next exhibition, do not ask your designer or design firm, “How can we make the booth look more attractive?” Instead, ask them, “How will this spatial layout help our sales team conduct 50 successful meetings a day? And how will this interactive display assist in capturing data from 200 interested prospects?”
By bridging art with logic and design with data, every corner of your exhibition stand becomes a smart investment that translates directly into your company’s financial results.


Comments